
Relationship Between Foodborne Illness Risk Factors and Socioeconomic Level in Restaurants in Riverside County, CA.

Sarah Crossman
Supervising Environmental Health Specialist, Riverside County Department of Environmental Health
Abstract
This study reviewed the relationship between average points deducted for each violation, average number of violations identified per facility, average number of violations identified per inspection, and frequency of foodborne illness risk factors found during sanitation health inspections between 2017 to 2019, and the socioeconomic levels cities where restaurants were located in Riverside County, CA. The relationship between foodborne illness risk factors and knowledge violations also was explored. Inspection violations were examined for restaurants in operation in six cities: three with a high percentage of people living in poverty, and three with a lower percentage of people living in poverty, in Riverside County, CA. The average points deducted for each foodborne illness risk factor observed during routine inspections were independent from the socioeconomic level of the city in which the restaurant was located, and the complexity of food processes (medium- or high-risk) conducted at the restaurant. The average number of foodborne illness risk factors observed per facility was unrelated to the poverty level of the city in which the restaurant was located. There was a relationship between the socioeconomic level of the city in which a restaurant was located and the number of violations observed during a routine inspection. Cities with higher poverty tended to have more food from unsafe source violations during routine inspections. Restaurants in lower poverty cities tended to have more improper cooking temperature violations. There also was a relationship between insufficient employee knowledge and poverty level of the city in which the restaurant was located, with high poverty city facilities incurring more food safety knowledge violations than expected. There was no relationship found between foodborne illness risk factors observed and the presence of a knowledge violation.
Key words: foodborne illness, poverty, risk factor, violation, inspection, knowledge.
Relationship Between Foodborne Illness Risk Factors and Socioeconomic Level in Restaurants in Riverside County, CA.
Background
Riverside County, California was established in 1893 and is the fourth largest county in California (County of Riverside, 2021). The Riverside County Environmental Health Department is the third largest Environmental Health Department in California with more than 60 inspectors dedicated to the District Environmental Services Branch which oversees, among other programs, sanitation inspections for more than 11,000 retail food facilities (Riverside County Department of Environmental Health, 2021).
Socioeconomic level of a population has been shown to be related to the level of health care (McMaughan, et al., 2020) and physical well-being of that population (Wang & Geng, 2019). People living at lower socioeconomic levels have been identified as having lower levels of well-being (Wang & Geng, 2019). A person who becomes ill in a more depressed socioeconomic community has a higher probability of a negative health outcome (McMaughan, et al., 2020). Another study found people in lower socioeconomic levels had a higher incidence of domestically acquired salmonellosis (Hadler, et al., 2020). However, people were found to have higher incidences of foodborne illness pathogens in higher socioeconomic census tracts (Whitney, et al., 2015).
A previous study found an increase in frequency of health inspections resulted in a reduction in food safety violations over time, and inspection scores improved with subsequent inspections (Jones, et al., 2004). Another study found more violations at nonchain vs chain restaurants in Philadelphia, PA (Leinwand, et al., 2017). As a health inspector, this researcher has observed that most nationwide chain restaurants within the researcher’s jurisdiction, are provided with procedures, reference materials, and other means (and incentives) by corporate management to assist in meeting corporate and public health standards.
Routine sanitation health inspections are conducted in Riverside County by trained inspection staff. Inspectors are trained and given discretion when conducting an inspection to determine if an observed violation is a major, minor, or noted violation. A major violation requires immediate correction or facility closure, and designated points are subtracted from the facility’s score for each major violation. A minor violation requires correction but is not an immediate threat to health and safety, and fewer points are deducted for such a violation. A noted violation requires correction, but no points are deducted from the inspection score.
Restaurants in Riverside County are classified based on risk posed to public health. Restaurants that are only open for business for a short duration of time during the fiscal year are considered a low risk to public health and receive one inspection per year. Restaurants that conduct limited food preparation: portioning; heat to serve; or assembly of food, pose a medium risk to public health. Medium-risk facilities are allocated two routine inspections a year. Food facilities that conduct extensive food preparation: thawing; cooling; grinding raw ingredients; reheating for hot holding; and other multi-process food preparations pose a higher risk to public health. High-risk facilities are slated to receive three routine inspections each year.
The United States Census Bureau’s definition of poverty is: “If a family's total income is less than the family's [poverty] threshold, then that family and every individual in it is considered in poverty.” (U.S. Census Bureau, 2021). This study seeks to determine if there is a relationship between socioeconomic level of the city in which a restaurant was located and the prevalence of food safety violations.
Problem Statement
The relationship between foodborne illness risk factors and socioeconomic levels of the city in which restaurants were located in Riverside County, CA between 2017-2019 is unknown.
Research Questions
1. What are the three cities with the highest and lowest poverty levels in Riverside County?
2. What does restaurant inspection data show for the identified communities in terms of foodborne illness risk factors from 2017-2019?
3. Is there a relationship between foodborne illness risk factors and the socioeconomic level of the city in which the restaurant is located?
4. Is there a relationship between knowledge-type violations observed and foodborne illness risk factor violations?
Methodology
Phase One: Obtain data for the percentage of people living in poverty for cities in Riverside County from the U.S. Census website. The three cities with the lowest and highest percentage of people living in poverty within the County of Riverside were identified.
Phase Two: Riverside County has an electronic inspection system and database which is used when conducting inspections. Violations are entered into the database, including the severity of the violation (major/minor/note). The facilities examined were low, medium and high-risk restaurants, chain and nonchain, which handle food and use multiple food processes in their operation. A query was run to gather the information from the system for applicable restaurant operations located in the six cities identified as high poverty and low poverty areas.
Phase Three: Inspection violations for restaurants in operation from 2017 to 2019 in all six cities were examined. Analysis of data was conducted once the restaurants were grouped by risk and if they were a chain restaurant or nonchain restaurant using the following groupings: low, medium and/or high-risk food processes chain and nonchain restaurants; medium and/or high-risk food processes chain and nonchain restaurants; restaurants conducting high-risk food processes, chain and nonchain restaurants; and restaurants conducting high-risk food processes not associated with a chain.
Violations that corresponded to a CDC foodborne illness risk factor and resulted in point deductions (major or minor violations) from the routine inspection score were examined. The average points deducted for each violation during routine inspections was computed by taking the total points deducted for the identified restaurants from 2017 to 2019 and dividing that by the number of violations (major, minor) identified. This average points deducted was calculated for restaurants conducting medium and/or high-risk food processes, chain and nonchain restaurants; restaurants conducting high-risk food processes, chain and nonchain restaurants; and restaurants conducting high-risk food processes and not associated with a chain. No data was available for low-risk restaurants. A correlation between the average number of points deducted per violation for each city and poverty level was run to determine if a relationship existed.
All violations that corresponded to a CDC foodborne illness risk factor were identified (major, minor, and noted violations). The average number of violations identified per facility was computed. A correlation between the average number of violations identified per facility for each city and the poverty level was run to determine if a relationship existed.
All violations that corresponded to a CDC foodborne illness risk factor were identified (major, minor, and noted violations). The average number of violations identified per inspection was computed by taking the total violations identified and dividing by the number of routine inspections. To determine if a relationship existed, correlation between average number of violations identified per inspection for each city, and poverty level, was run.
A chi-square significance test was performed to see if there was a relationship between the frequency of foodborne illness risk factors and poverty level of the city in which the facility is located. The foodborne illness risk-factor violation data used was for restaurants conducting high-risk food processes, where a minor or major violation was identified. The expected frequencies of each foodborne illness risk factor were calculated, assuming it is independent of poverty level. A chi-square significance test was performed to determine if the data fit the hypothetical expected frequencies of foodborne risk factors.
Once the percentage for the prevalence of each foodborne illness risk factor was calculated, the expected number of times a foodborne illness risk factor is to occur, assuming independence from poverty level, was calculated. If poverty level in a city has no effect on the frequency a foodborne illness risk factor determined, the percentages of foodborne illness risk factors obtained with the above process would be the same in a city with high poverty and in a city with low poverty. Once the expected number of foodborne illness risk factors was calculated, a chi-square test for each foodborne illness risk factor was performed to determine if there was a significant difference between foodborne illness risk factors actually found during routine inspections and those expected based on independence from the poverty level of the city in which the restaurant is located.
Examination of the relationship between foodborne illness knowledge violations and foodborne illness risk factors was conducted. A chi-square test was used to determine if there was a significant difference between foodborne illness knowledge violations found, and those expected, based on independence from foodborne illness knowledge violations.
Results
The three cities identified by the U.S. Census Bureau as having the highest percentage of people living in poverty in Riverside County in 2019 were: Desert Hot Springs with 31.1%; Blythe with 25.5%; and Coachella with 21.8% of people living in poverty. The three lowest poverty cities were Temecula with 6.9%, Indian Wells with 6.7%, and Eastvale with 5.9% of its population living in poverty. Table 1 shows the violation numbers on the Riverside County food facility inspection report to their corresponding CDC foodborne illness risk factor.
Table 1
Relationship of Violation from Inspection Reports to CDC Risk Factor

There was no significant correlation (-0.35≤r≤-0.26) found between average points deducted for each violation during a routine inspection and the poverty level of the community in which the facility was located. The negative correlations observed indicate that, as poverty levels increase in a city, there is a slight decrease in the average points deducted for each violation for the restaurants located in that city.
There was no correlation (-0.04≤r≤0.08) found between a city’s poverty level and the average number of minor/major violations observed per facility at restaurants. The type of food processes, whether the restaurant was a chain or nonchain did not materially affect the correlation.
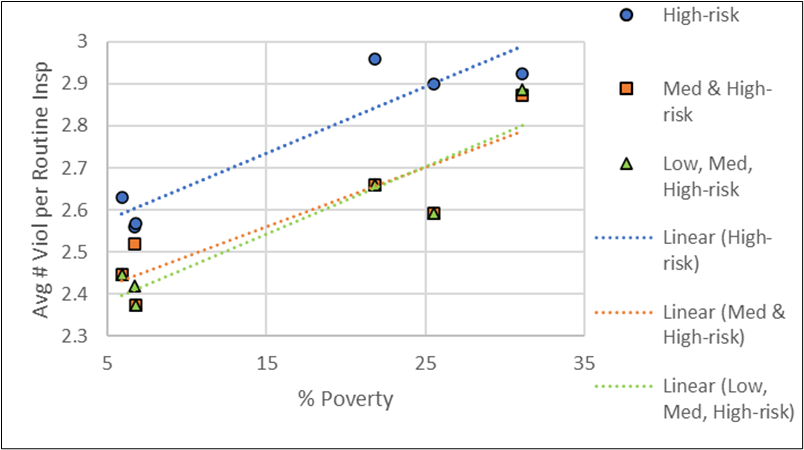
There was a moderate correlation (r=0.44) found between the average number of violations (minor/major/note) discovered per routine inspection and poverty level for cities in which the restaurants conducting high-risk food processes not associated with a chain were located. Chart 1 illustrates the strong correlation (r=0.94) found between a city’s poverty level and restaurants conducting high-risk food processes (chain and non-chain restaurants). There also was a strong correlation (r=0.89) found in the case of medium- and high-risk restaurants, chain and non-chain. There also was a strong correlation (r=0.93) found between a city’s poverty level and restaurants conducting low, medium, high risk food processes (chain and non-chain restaurants). It should be noted that only half of the cities (Desert Hot Springs, Indian Wells, and Temecula) had low risk restaurants.
Chart 1
Poverty/Average Number Violations Identified per Inspection Correlation
Cities with lower levels of poverty were found to have significantly more improper cooking temperature violations (minor/major) than expected (chi-square p=0.05). Restaurants in cities with higher levels of poverty were found to have significantly more food from unsafe sources (chi-square p=0.00) and more insufficient employee knowledge violations (chi-square p=0.01) than expected. The remaining foodborne illness risk-factor violation types were independent of the poverty level of the city in which the facility was located.
A chi-square test was run to determine if a relationship existed between foodborne illness risk factors found during an inspection, and the presence of a knowledge violation (minor). The data did not significantly differ from those values expected under the assumption that foodborne illness risk factors are independent from knowledge violations. Therefore, no relationship existed between foodborne illness knowledge violations and foodborne illness risk factors, within the study population.
Conclusions
The average points deducted for each major or minor foodborne illness risk factor observed during routine inspections was independent from the socioeconomic level of the city the restaurant was in and the type of food processes (low, medium or high-risk) conducted at the restaurant. Inspectors have discretion on the number of points deducted and based on this information, deducted points or scored facilities in a fairly consistent manner. As poverty level rises, there is a slight decrease in the average points deducted for each violation; the correlation is weak and could be a reflection of the individual inspector’s discretion.
The average number of foodborne illness risk factors for which points were deducted per facility was not correlated with the poverty level of the city in which the restaurant was located. The poverty level of the location of a facility had no bearing on the average number of violations for which an inspector would deduct points.
Based on the results, there was a relationship between the socioeconomic level of the city in which a restaurant was located and the number of violations, both where points were and were not deducted, observed during a routine inspection. Restaurants conducting low, medium, and/or high-risk food processes, chain and nonchain, in cities with more poverty, had more violations identified during routine sanitation health inspections. More of the identified violations were denoted as a note, and points were not deducted against the overall inspection score for these facilities. While inspectors are trained to be business friendly, and to gain compliance through education, why more violations were marked as notes instead of a major/minor violation in high poverty cities is not clear.
Subsequently restaurants conducting high-risk food processes and not associated with a chain in a city with less poverty had fewer violations observed and fewer noted violations. When looking at nonchain restaurants conducting high-risk food processes, the poverty of the city was not a strong predictor of the number of violations observed during a routine inspection. There was a moderate correlation between socioeconomic level of a city and average number of major/minor risk factors found per routine inspection, with high-risk restaurants in higher poverty cities having slightly more risk factor violations found than their counterparts in lower poverty cities.
Cities with higher poverty rates tended to have more food from unsafe source major/minor violations during routine inspections. Restaurants in lower poverty cities tended to have more improper cooking temperature major/minor violations. There also is a relationship between insufficient employee knowledge and poverty, with higher poverty cities having more food safety knowledge violations (minor) than expected. The data demonstrate that these three types of inspection violations were not independent of poverty level.
There was no relationship found between major/minor foodborne illness risk factor violations found during an inspection and the presence of a knowledge violation; therefore, the presence of a foodborne illness risk factor violation, not indicative of a knowledge violation, also would be observed, and vice versa. They were independent of each other. In Riverside County, inspectors are taught to not mark both risk factor and knowledge violations on the report when a risk-factor violation is observed.
Recommendations
The following are suggestions for future research:
1. Conduct a similar study using data for other jurisdictions.
2. Examine why inspectors noted more violations per inspection in economically challenged cities and whether the notes correlate to decreased violations observed at subsequent inspections.
3. Examine the types of foods that are prepared to see if all types of food safety knowledge are significant for restaurants in areas of higher poverty. For example, if a restaurant were to boil chicken for hours to make shredded chicken every day, would the employees really need to know that chicken needs to be cooked to 165°F or does the nature of how the food is prepared negate the need for some specific food safety knowledge?
4. Conduct research to determine whether health officials need to tailor the information, education, and training provided to restaurants, based on the area where they are located, to address the more prevalent violations seen.
5. Explore why knowledge violations and the presence of foodborne illness risk factor violations are independent.
6. Explore whether inspector focus needs to shift, during an inspection, away from knowledge and focus on the foodborne illness risk factors.
7. Research whether the direct involvement of high functioning owners and fewer hired staff with less liability account for decreased violations in nonchain restaurants conducting high-risk food processes.
Acknowledgments
I want to express my gratitude to the IFPTI staff, fellowship colleagues, and mentor, Kathy Fedder, for their assistance and support. I thank my Department and colleagues, especially: Dottie and Ken; my incredible staff; and Chris Niva with RCIT who encouraged me and supported me during the fellowship. I would also like to acknowledge my incredible husband, Michael, and my daughter, Rebecca, who serve as my daily inspiration for life.
References
Hadler, J. L., Clogher, P., Libby, T., Wilson, E., Oosmanally, N., Ryan, P., Magnuson, L., Lathrop, S., Mcguire, S., Cieslak, P., Fankhauser, M., Ray, L., Geissler, A., & Hurd, S. (2020). Relationship between census tract—level poverty and domestically acquired salmonella incidence: Analysis of foodborne diseases active surveillance network data, 2010–2016. The Journal of Infectious Diseases, 222(8). https://academic.oup.com/jid/article/222/8/1405/5638199
Jones, T. F., Pavlin, B. I., LaFleur, B. J., Ingram, L. A., & Schaffner, W. (2004). Restaurant inspection scores and foodborne disease. Emerging Infectious Diseases, 10(4), 688–692. https://doi.org/10.3201/eid1004.030343
Leinwand, S. E., Glanz, K., Keenan, B. T., & Branas, C. C. (2017). Inspection frequency, sociodemographic factors, and food safety violations in chain and nonchain restaurants, Philadelphia, Pennsylvania, 2013-2014. Public Health Reports (Washington, D.C. : 1974), 132(2), 180–187. https://doi.org/10.1177/0033354916687741
McMaughan, D.J., Oloruntoba, O., & Smith. M. L. (2020) Socioeconomic status and access to healthcare: Interrelated drivers for healthy aging. Frontiers in Public Health 8(231). https://www.frontiersin.org/articles/10.3389/fpubh.2020.00231/full
Riverside County Department of Environmental Health. https://www.rivcoeh.org/OurServices/Foods
Riverside County Homepage. https://rivco.org/
United States Census Bureau (2021). Persons in poverty, percent. https://www.census.gov/quickfacts/fact/note/US/IPE120220
Wang, J. & Geng, L. (2019). Effects of socioeconomic status on physical and psychological health: Lifestyle as a mediator. International Journal of Environmental Research and Public Health, 16(2). https://www.ncbi.nlm.nih.gov/pmc/articles/PMC6352250/
Whitney, B. M., Mainero, C., Humes, E., Hurd, S., Niccolai, L., & Hadler, J. L. (2015). socioeconomic status and foodborne pathogens in Connecticut, USA, 2000–2011. Emerging Infectious Diseases, 21(9), 1617-1624. https://doi.org/10.3201/eid2109.150277.
Author Note
Sarah Crossman, Supervising Environmental Health Specialist
County of Riverside Department of Environmental Health
This research was conducted as part of the International Food Protection Training Institute’s Fellowship in Food Protection, Cohort X.
Correspondence concerning this article should be addressed to:
Sarah Crossman, County of Riverside Department of Environmental Health P.O. Box 7909, Riverside, CA 92513-7909
SCrossman@rivco.org
Funding for the IFPTI Fellowship in Food Protection Program was made possible by the Association of Food and Drug Officials.