
Characterization of Food Safety Complaints in Loudon County, VA

George Khan
Environmental Health Manager -
Loudon County Health Department

Abstract
This research analyzed consumer complaints in food establishments in Loudoun County, VA, and determined the relationship of complaints to violations observed during inspections by Environmental Health Specialists (EHS). The study examines data from January 2017 through December 2021, which was obtained from the Loudoun County Express Request system and the statewide Environmental Health Database. The paper discusses the rise in consumer complaints, and the importance of customer satisfaction for businesses in the food service industry. The study seeks to answer research questions related to the characteristics of food establishment consumer complaints, the most observed food safety violations, identifiable differences between complaints from rural and urban areas, and whether food safety trends may be identified through the analyses of consumer complaints and EHS violations. The study's findings may help establish a more proactive approach to food safety and assist in refocusing inspections and increasing education and interactions by EHS within the food establishments.
Keywords: Food, Safety, complaints, inspection, violations.
Characterization of Food Safety Complaints in Loudon County, VA
Background
Consumer complaints are on the rise and becoming more challenging, as indicated by a social media survey conducted by the National Customer Rage study conducted by Customer Care Measurement & Consulting LLC in partnership with the W.P. Carey School of Business at Arizona State University and Kraft Heinz Co (CCMC 2020). Sixty-six percent of consumers in the 2020 survey said they had experienced a problem with a product or service, an increase from 56% in 2017 when the survey last was conducted. Most of those who complained said they weren’t satisfied with the product or service, while 58% said they received nothing in return. In 2020, consumers informed twice as many people about their negative experiences according to the same CCMC survey.
Customer satisfaction may be a factor for businesses to understand to sustain their commercial viability and increase their profitability. The customer experience may have an impact on customer behaviors, including things such as: not returning to the business for repeat visit; offering negative comments or reviews; or relating comments about another social post’s positive or negative situation they have experienced.
Foodservice businesses, which are an important part of the service sector, need to be aware of customer satisfaction to create a loyal customer base. A 2020 Innovating Commerce Service Communities (ICSC 2020) survey showed 64% of adults spend an average of $71 dining out once per week. Studies examining customer complaints within the food industry have utilized many methods to classify complaints. Restaurant customers were respectively found to complain about staff, then food and drink, service, price, servicescape and menu (Erdem and Yay, 201).
This study analyzed consumer complaints received by LCHD against food establishments located in Loudoun County, VA. The county has a population exceeding 450,000, with a median household income of $147,111, which is the highest median household income of any county in the United States. Due to its geographic location, proximity to Washington DC, and its history as a refugee resettlement locality, the population of Loudoun County is very diverse. Local policies aimed at preserving the County’s rural economy have significantly impacted the population density as shown in Figure 1, with the eastern half of the county very densely populated while the western half of the county is considered rural and agriculturally based (Zolnik, Edmund 2013).
Figure 1
Percentage change in residential population density between 2000 and 2005 in Loudon County, Virginia.

LCHD is one of 35 health districts in Virginia and serves only the county of Loudoun. LCHD primarily operates in response mode when addressing food safety-related complaints. Due to the logistical challenges of permitting and providing other mandated services, no analysis has been conducted after complaints have been completed and noted as closed in the database. All complaints received by LCHD are shared with the facility and evaluated for risk to determine the next course of action to be taken by LCHD. Actionable consumer complaints lead to inspections and the discovery of violations. Not all complaints received are determined to be actionable based on the content of the complaint.
This study will characterize and analyze food safety-related complaints from January 2017 through December 2021 in Loudoun County, VA, and determine any correlations with violations observed by Environmental Health Specialists (EHS) during routine facility food safety inspections. The characterization of the complaints during this period may highlight trends that could be further analyzed and used to establish a more proactive approach to food safety. Analyzing consumer complaints may be an opportunity to gain customer perspective, and to cross-reference the complaint with EHS inspection violations. This cross-referencing approach may be a valuable tool in refocusing the inspection, and educating, and interacting with the food establishments.
Problem Statement
The characteristics of food establishment consumer complaints and their relationship to violations observed during inspections by EHS in Loudon County are unknown.
Research Questions
What are the characteristics of food establishment consumer complaints received by the Loudon County Health Department between January 1, 2017, and December 31, 2021?
What are the most observed food safety violations within these establishments?
What are the identifiable differences between complaints from rural vs urban areas?
What insights may be gained from analyzing consumer complaints and EHS violations in relation to food safety trends?
Methodology
The study analyzed customer complaints that were gathered from data reported to LCHD from the Loudoun County Express Request (LEX) system between January 1, 2017, and December 31, 2021. The LEX database contains complaints submitted directly to LCHD and those submitted to the Virginia Department of Health (VDH). To be able to compare data across two different databases, the LEX complaint data was screened to exclude non-actionable complaints and complaints reported against facilities that were not permitted for operation during the study period. The remaining complaints were categorized as top-five categories, which then were used to align inspection violation data with the complaint data. A heat map was generated to demonstrate the geographical distribution of complaints and identify any unique characteristics between complaints against facilities located in urban versus rural areas.
The EHS inspection data was obtained from VDH statewide Environmental Health Database (EHD), which contained all violations cited by EHS during routine, follow-up, and complaint inspections. This database categorizes the EHS violations, according to the State of Virginia 2015 Food Code, which cited violations using 56 different code sections. For this study, 28 of the 56 code sections were analyzed and aligned with the top five complaint characterizations from the LEX database. The facilities included in this study all were permitted throughout the study period. Not included was with the exception of any facility that was temporarily closed or permanently closed, had a change of ownership, or had its permit suspended.
Additionally, the database contained the risk classification which directly translated to the number of inspections a facility is expected to receive in one year. In the study, the risk classification was analyzed for any relationship between inspection frequency and the number of complaints. To synchronize the inspection data and the complaint data, which were stored in two separate databases, the facility name and address were used as reference points. To ensure accuracy, the classification or complaint grouping was limited to match the two datasets. The analysis was performed using Excel spreadsheets and a combination of custom pivot tables.
Results
During the study period from January 1, 2017, through December 31, 2021, LCHD permitted more than 1,500 food facilities. For the study, a total of 884 facilities were considered after removing those that were temporarily closed, permanently closed, experienced a change of ownership, or had their permit suspended. Over the same period, 831 consumer complaints were logged into the LEX database for food facilities located within Loudoun County. The complaint location across the county is displayed in
Figure 2
Heat map showing complaint distribution for Loudon County 1/1/2017 to 12/31/2021.
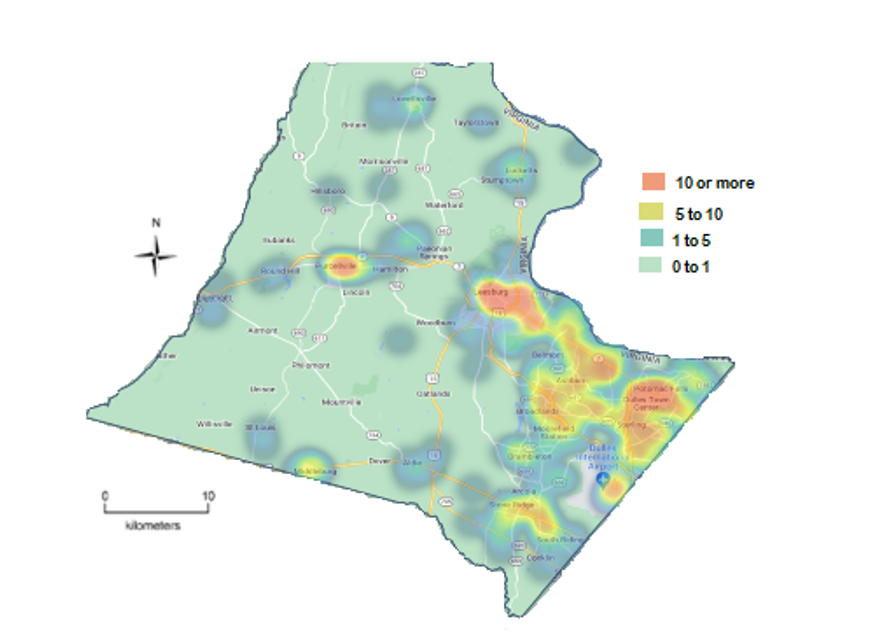
Of the 831 complaints, 338 were deemed actionable and resulted in a complaint inspection conducted by an EHS. These 338 complaints were lodged against 222 of the 884 facilities included in the study. The complaints were distributed across 25% of the 884 facilities, with nearly 9% of facilities receiving multiple complaints. The complaint analysis identified the top five categories as possible foodborne illness, cleanliness, food adulteration, food handling, and vermin. The distribution of actionable complaints across these categories is shown in Figure 3, with possible foodborne illness being the most frequently reported category.
Figure 3
Consumer complaints characterized by category from 2017 to 2021.

During the same time frame, data from the EHD database indicated that EHS cited 15,595 violations across 884 facilities. These violations were cited across 28 separate food-specific codes, resulting in an average of 17.2 violations per facility. The violations were grouped within the same categories as the complaints, as shown in Figure 4. The inspection data also indicated that possible foodborne illness related violations were cited within the same category.
Figure 4
Environmental health violations grouped by complaint category.

The data was analyzed to examine the relationship between complaints and inspection violations. Facilities with no complaints were cited for an average of 13.4 violations, while facilities with one or more complaints had average cited violations ranging from 24.7 to 36.2. Figure 5 illustrates the relationship between complaints and violations, with violations cited increasing as the number of complaints received increased.
Figure 5
Average violations vs the average number of complaints for a facility.

NC indicates a facility with no complaints and 3+ indicates a facility with three or more complaints.
The data then was analyzed to identify relationships between inspections and complaints. The resulting analysis showed a strong correlation between the number of complaints and the number of inspections. Facilities receiving one inspection per year received a higher number of complaints verses facilities that were inspected more than once per year. Figure 6 shows that as the number of inspections increases, we see a decrease in customer complaints.
Figure 6
Average inspections against the number of complaints

Zero indicates a facility with no complaints and 3 indicates a facility with 3 or more complaints.
Conclusions
LCHD received over 831 complaints, of which 332 were considered actionable and resulted in an inspection by an EHS.
Analyzing the five complaints grouping showed that illness was consistently the top category throughout the study. Limiting the grouping was necessary to align the complaint data with the EHS inspection data, which supported violations related to possible foodborne illness as the most cited category.
Data within the heat map showed that although Loudoun County is vast, most complaints were located within highly populated areas. This type of heat map could be used to realign resources within these hotspots.
The 332 complaints showed that possible foodborne illness was the highest driver of complaints, with a significant number also referencing cleanliness.
Data within the heat map showed a significant number of complaints located away from the more highly populated areas, and data within those complaints showed that while possible foodborne illness was the top category, complaints not specific to foodborne illnesses were more common. This data showed that tracking complaints could identify facilities that require redirecting additional staff time. The 222 food facilities that received one or more complaints also had an increased number of violations cited by EHS during their inspections.
The data supported the positive correlation between the number of complaints and the number of violations cited by EHD; facilities with more violations tended to receive more complaints.
Recommendations
Based on the conclusions of this study, the following recommendations are proposed:
Although food establishments receive notifications of customer complaints submitted to the health department, providing more outreach on non-actionable complaints may help decrease the number of complaints and enhance customer satisfaction.
Health departments may benefit from conducting a deeper analysis of customer complaints, after these complaints have been investigated and closed, to identify trends that can be used to establish a more proactive approach to food safety.
The study highlights the need for more education and interaction with food establishments by EHS to improve food safety standards. Using tools like heat maps may provide a more focused educational experience to address the specific needs of the area.
Research examining the differences between rural and urban areas, in terms of food safety standards, may identify differences or similarities between complaints from these areas.
Acknowledgements
I would like to express thanks to the following:
Loudoun County Health Department for allowing me the flexibility to complete.
Victor Avitto, EH Supervisor with LCHD for all his assistance with extracting and analyzing the data.
Doug Saunders for his mentorship.
The IFPTI staff for their support.
References
Erdem, Ö., & Yay, Ö. (2017). Evaluation of Customer Complaints in Tripadvisor: Case of Antalya. Journal of Tourism and Gastronomy Studies, 5(4), 227-249.
“ICSC Finds Two-Thirds of Consumers Spend over $600B a Year on Dining Out.” Business Wire, 25 Feb. 2020, www.businesswire.com/news/home/20200225005725/en/ICSC-Finds-Two-Thirds-Consumers-Spend-600B-Year.
Min, K. H. (2016). Selection attributes and satisfaction of ethnic restaurant customers: A case of Korean restaurants in Australia. International Journal of Tourism Sciences, 16(4), 151-169.
Şeker, F., Unur, K., & Erdem, A. (2019). Market segmentation and travel choice prediction in spa hotels through TripAdvisor’s online reviews. Journal of Recreation and Tourism Research, 6(4), 317-331. https://www.sciencedirect.com/science/article/abs/pii/S0278431918302457
Şengül, S., Çavuş, O., & Taşkın, E. (2018). Analysis of e-complaints for restaurant enterprises in the world's 50 best restaurant list. Journal of Tourism and Gastronomy Studies, 6(1), 320-334.
2020 National customer rage study. Customer Care Measurement & Consulting (CCMC). (2022, November 15). https://www.customercaremc.com/insights/national-customer-rage-study/2020-national-customer-rage-study/
Zolnik, Edmund. (2013). Growth Management and Resident Satisfaction with Local Public Services. Urban Geography. 32. 662-681. 10.2747/0272-3638.32.5.662.
Author Note
George Khan, Environmental Health Manager
Loudoun County Health Department
This research was conducted as part of the International Food Protection Training Institute’s Fellowship in Food Protection, Cohort XI
Correspondence concerning this article should be addressed to:
George Khan, Loudoun County Health Department,
1 Harrison Street SE Leesburg, VA 20177
Funding for the IFPTI Fellowship in Food Protection Program was made possible by the Association of Food and Drug Officials.